-

Customer Experience -

Employee Experience -

Brand Experience -

Product Experience -

Core XM -

Design XM
Guided Solutions
What's on This Page:
About Guided Solutions
Solutions help you build questions and blocks based on information you set, such as product names or the method you’d like to use to collect information. The question structures used in solutions are based on industry-standard research designs and perfected by subject-matter experts.
Solutions are different from templates, in that templates create a survey for you, whereas solutions take you step by step through the survey creation, distribution, and reporting process. You can look through a list of solutions in the XM Marketplace.
Getting Access to Guided Solutions
If you’re interested in getting access to one of these solutions, please reach out to your Qualtrics Account Executive. Please note that solutions available to you may depend on the features enabled to your license. For example:
- Any solutions with dashboards listed require access to CX Dashboards.
- Any solutions with digital intercepts listed require access to Website / App Feedback.
- Any solutions with tickets listed require the “Use Qualtrics Tickets” permission.
If a solution requires a permission not listed above, it will be noted in its description.
Access to certain solutions will be tied to certain feature permissions associated with the solution. If you need to have a permission enabled in your account, reach out to your Brand Administrator. Brand Administrators, see User, Group, and Division Permissions.
List of CX Guided Solutions
Digital Customer Journey Optimization: Understand your customers’ overall digital experience, personalize customer interactions, diagnose and fix disruptive journey touchpoints, or identify how the digital journey can be improved in order to drive conversion. This solution includes 11 premade surveys, a website feedback project filled with fully customized digital intercepts, and an expertly designed dashboard, all inside a digital program.
E-Commerce Experience Optimization: Understand customer needs and preferences, leading to insights that can improve customer conversion and retention. This solution provides you with premade surveys, digital intercepts, and dashboards designed by experts to help you quickly launch your digital customer experience program.
App Optimization: This solution is designed for those who seek to understand customer needs and preferences in order to be able to optimize the mobile app experience. It can also be used to drive product development and innovation in your mobile app and create better digital experiences for your customers. This solution includes 10 premade surveys, a website feedback project filled with fully customized digital intercepts, and an expertly designed dashboard, all inside a digital program. In addition to standard XM Solution permissions, this solution requires the “Access Mobile SDK” permission.
Digital Support Optimization: Deliver a consistent support experience between digital service channels (Help Articles, Support Pages, and FAQs) to human channels (live chat, phone call, social). The goal is to reduce customer effort as well as the cost to serve customers. This solution includes 5 premade surveys, a website feedback project filled with fully customized digital intercepts, and an expertly designed dashboard, all inside a digital program.
Customer Preference Collection: A solution designed around the data that a customer intentionally and proactively shares with a brand, which can include preference center data, purchase intentions, personal context, and how the individual wants the brand to recognize them. This solution includes 2 premade surveys, and a website feedback project filled with fully customized digital intercepts, all inside a digital program.
Relationship Health: Understand the experience of your customers through the sales and onboarding journey. Identify the moments that matter in order to resolve systemic issues, improve and emphasize experiences that are impactful, and take real-time action. The goal of this solution is to increase retention and loyalty by identifying and improving moments that matter across the end-to-end customer journey. This program includes premade surveys, workflows, and a dashboard.
Resident Experience: This solution was created for local and small government departments and communities. Measure, track, and improve your residents’ quality of life. This solution comes with premade surveys, a dashboard with text analysis, and workflows that add survey takers to your directory.
Customer Care Quickstart: Build and launch a standard Customer Care feedback program and easily uncover insights that drive value for your customers. This solution can provide either a fast time-to-value MVP program or serve as a starter program for less mature organizations. This solution includes 1 premade post transaction survey, pre-configured workflows (including metric change notifications, a dissatisfied customer ticket in Qualtrics, or ticket created in ServiceNow), and an expertly designed dashboard. In addition to the standard permissions listed, this solution requires access to the ServiceNow extension.
Quality Management: This solution was designed to make it easier to perform quality assurance on your customer care teams. Measure how your customer care team is performing with manual sampling, simple scorecards, and by tracking individual interactions. This solution includes 1 premade evaluation survey, supplemental data source, and expertly designed dashboard.
List of EX Guided Solutions
Candidate Experience Program: Continuously measure and act on candidate feedback across recruiting touchpoints with expert-designed and premade components.
Diversity, Equity, and Inclusion Solution: Use our validated model to identify Inclusion gaps and have confidence in how to close them. Our guided Diversity, Equity, and Inclusion (DEI) solution includes intersectional demographics and a robust Inclusion metric.
Experience Design for Workplaces: Hybrid XM Solution: This solution supports leaders who are determining the development and implementation of location and flexible work policies.
Experience Design for Workplaces: Office Program: This solution is created for company leadership and human resources teams to ensure employee feedback is considered in the development and implementation of an office location.
EX25 XM Solution: Employee Engagement program that allows you to measure employee sentiment and feedback using five key performance indicators: engagement, experience vs. expectations, intent to stay, inclusion, and well-being.
Well-being at Work Solution: Employee Engagement program that allows you to understand and take action on employee and team well-being within your organization.
Team Voice: A subset of Custom XM Solutions made with Human Resources teams in mind. Custom XM Solutions are premade surveys and reports made for your organization. In this case, you can encourage users on your Qualtrics license to collect feedback only using Human Resources-approved survey content that meets your Employee Experience program’s standards.
Japanese Stress Check Solution: Employee Engagement project that allows companies operating in Japan with over 50 employees to run a stress check survey as mandated by the Japanese government. This solution has a premade survey, dashboard, and automated distributions.
ETX Service Desk Experience XM Solution: This solution enables customers to launch Qualtrics methodology for service desk employee experience listening programs to improve the value they deliver to the employees of the organization. This solution has a premade survey and dashboard.
List of DesignXM Guided Solutions
Concept Testing Program: Program that identifies which product or service offers the best market opportunities by testing product features, branding, and messaging. These concepts are all managed in the same place, allowing you to view top concept scores and create dashboards to report out to your team.
Idea Screening XM Solution: Screen a set of ideas to discover which ideas resonate the most with your respondents. This solution targets early-stage innovation efforts to help you understand which ideas and product lines have the most potential before investing further in their development.
Audience Management Program: Create and manage your own panel of respondents.
Conjoint and MaxDiff: Receive feedback from respondents that allows you to easily narrow down the types of packages and products you should offer.
Creating Guided Solutions
- Click the global navigation in the top-left, next to the XM logo.
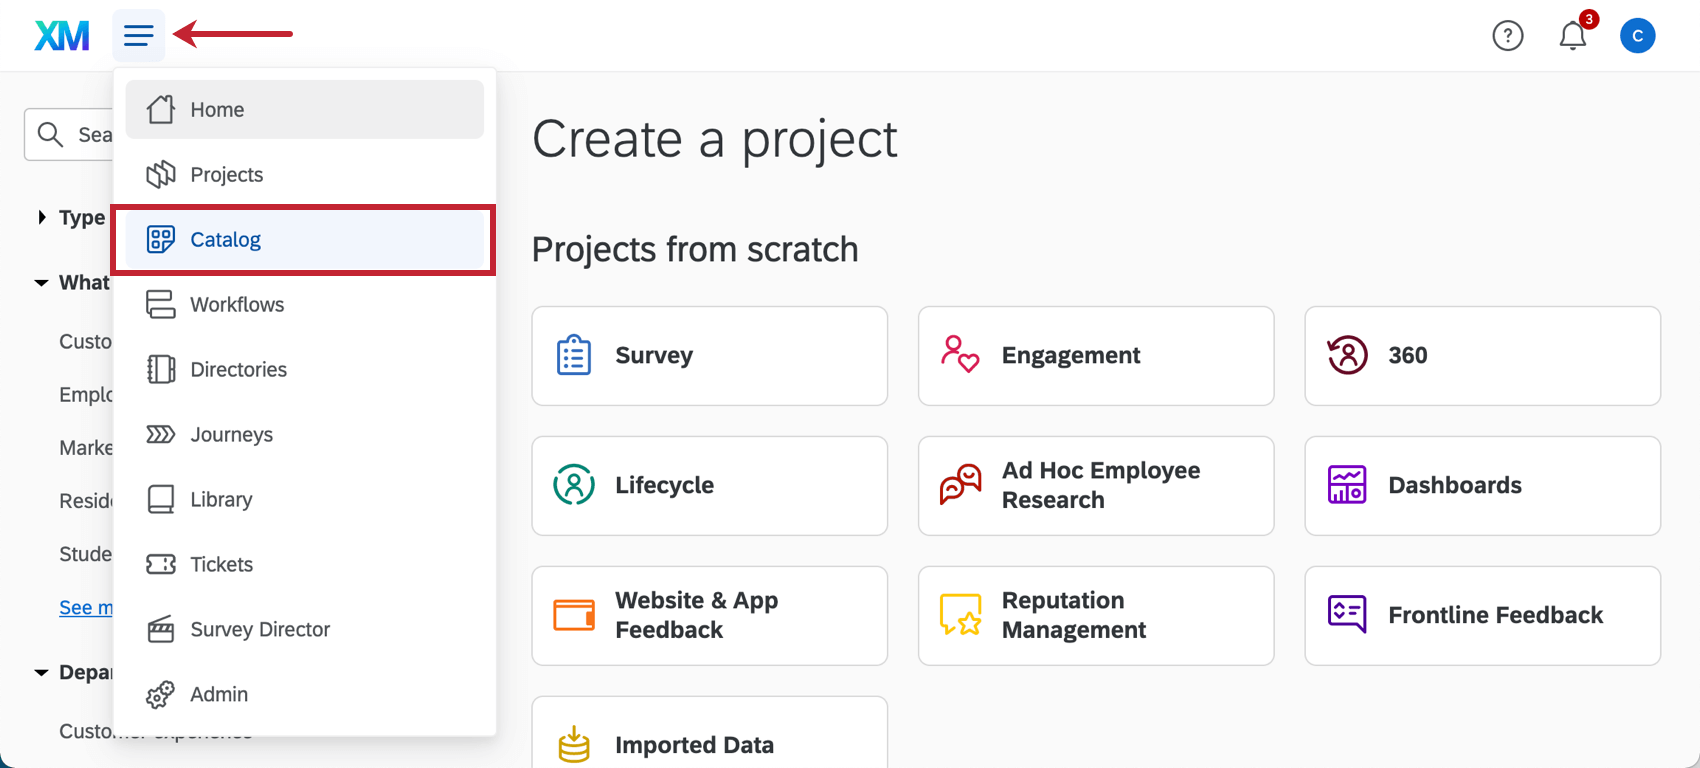
- Select Catalog.
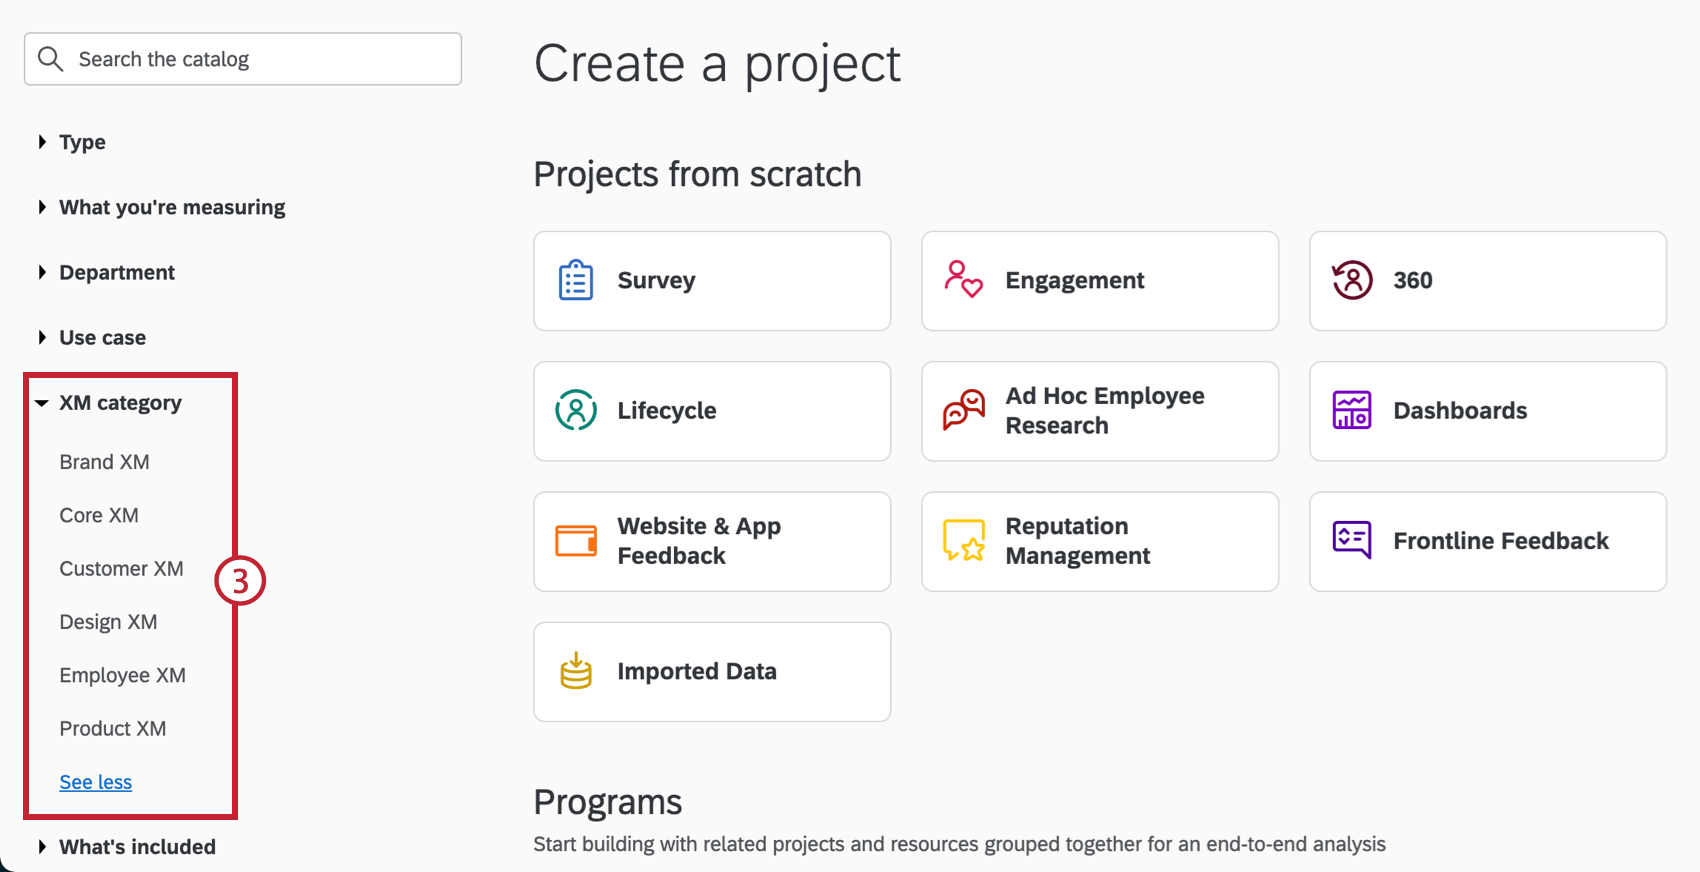
- Select the desired product line.
- Scroll down to the Guided projects section of the Catalog.
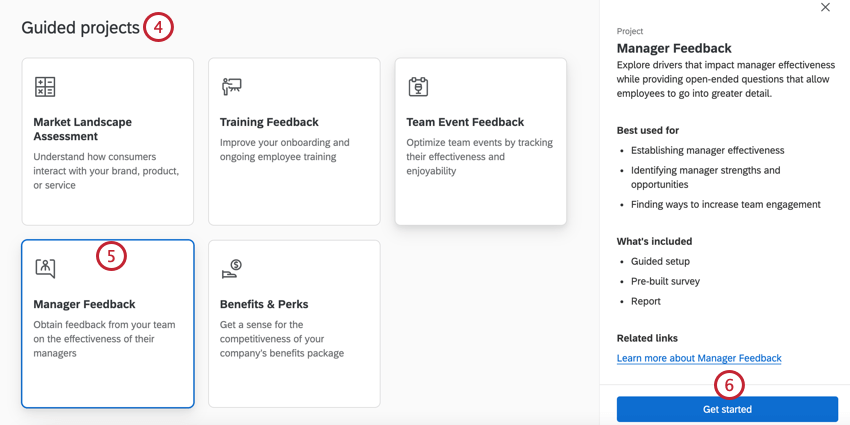
- Select the project you want to use. Make sure to read the project summary so you know what’s included and the best use case for the project.
- Click Get started.
- Name your project.
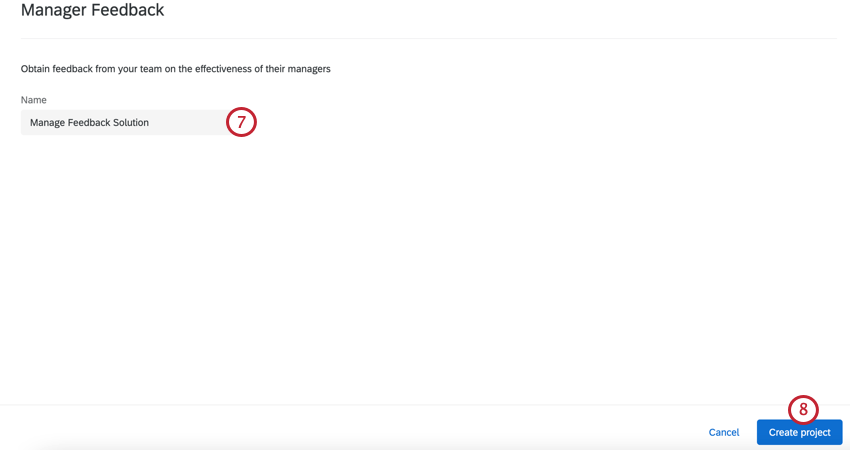
- Click Create project.
- Fill out the fields. These components will vary based on the solution you selected, and come with detailed descriptions of their purpose.
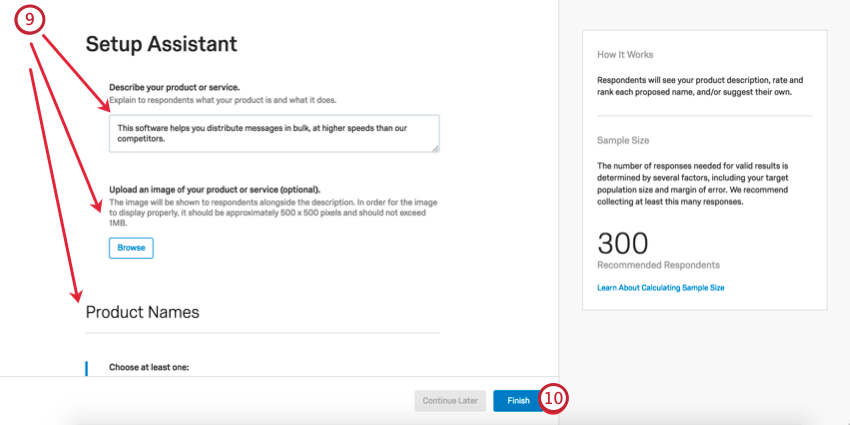
- When finished, click Finish.
- Once the initial setup is completed, use the Guidance panel on the right hand side to continue setting up your project.
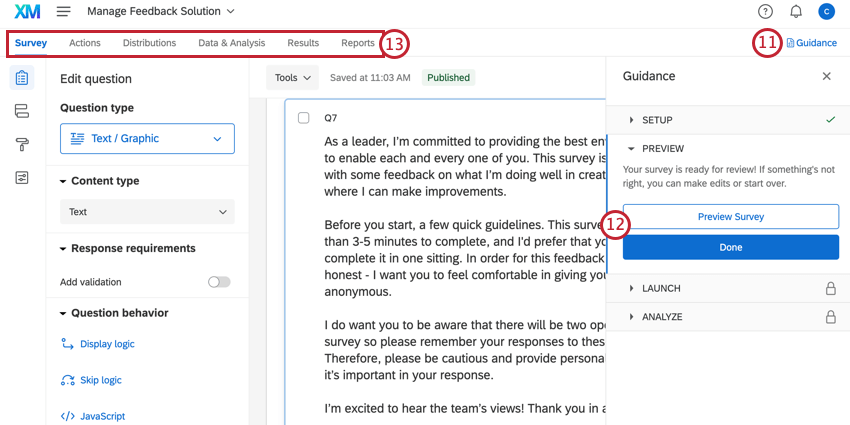
- To advance through the Guidance panel, follow the steps shown and click the blue buttons to continue.
- Use the tabs along the top if you’d like to edit components not included in the primary step. For example, you can go to the Survey tab to edit the survey theme and add demographic questions, whereas you can go to the Distributions tab to download a distribution history for emails you’ve sent.
Guidance
When you edit a guided solution, you’ll notice a menu labeled Guidance open on the right. This menu will guide you through the solution while you are on other sections of the project.
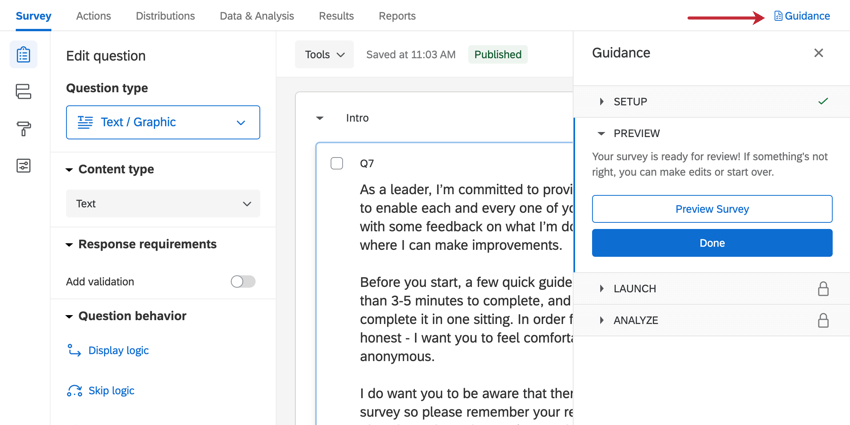
You can perform several functions with this guide:
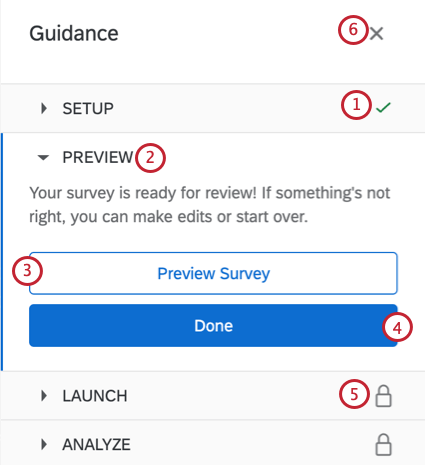
- The checkmark shows you steps that you’ve already completed. As you perform tasks in Qualtrics, these steps will check themselves to indicate they are finished. You can also click Done in a section to mark it as complete.
- Click a header to expand and collapse its content.
- Click the links to start performing that function in Qualtrics. For example, clicking Preview Survey takes you to your survey’s preview.
- When finished with a section, click Done to be automatically brought to the next.
- Sections yet to be completed will have a lock symbol. You need to complete previous steps before completing the locked steps.
- Click the X to close the menu and the button on the topmost-right to open it again.
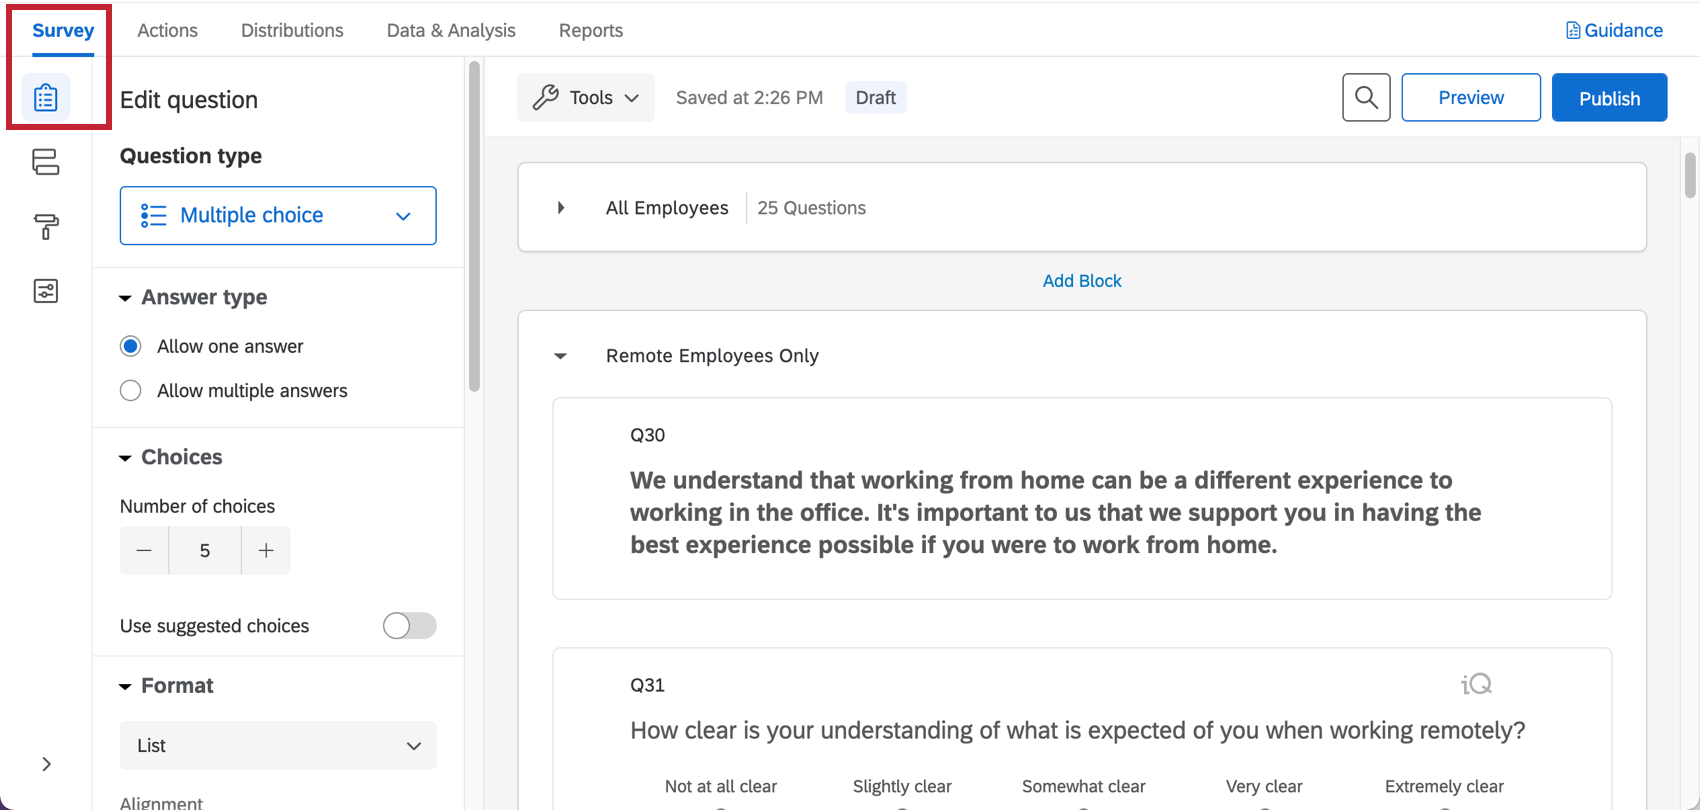
Survey Customization
If you want to see the questions in your survey or edit them, click the Survey tab. Once inside the survey builder, you can add new questions, tweak the wording on existing ones, edit the survey theme, and much more.
In this section, we’ll cover some of the fundamentals of survey editing. If there’s particular functionality you’d like to add that isn’t covered here, try searching the Support Site, or use the Support Site’s menu to the left to pick a page.
Adding and Editing Questions
You can add as many additional questions as you want. However, keep in mind that the shorter the survey, the more likely customers are to fill it out.
For guides to adding and editing questions, see:
Deleting and Restoring Questions
If you have sent a question to the trash, it is possible to restore it. To roll back many changes at once, see also how to revert a survey back to a previous version.
Piped Text
You may notice questions that have bracketed text in them. This text is called piped text, and it acts as a placeholder for other values. In this case, certain specifications you made during the project’s setup will be placed where the brackets are.
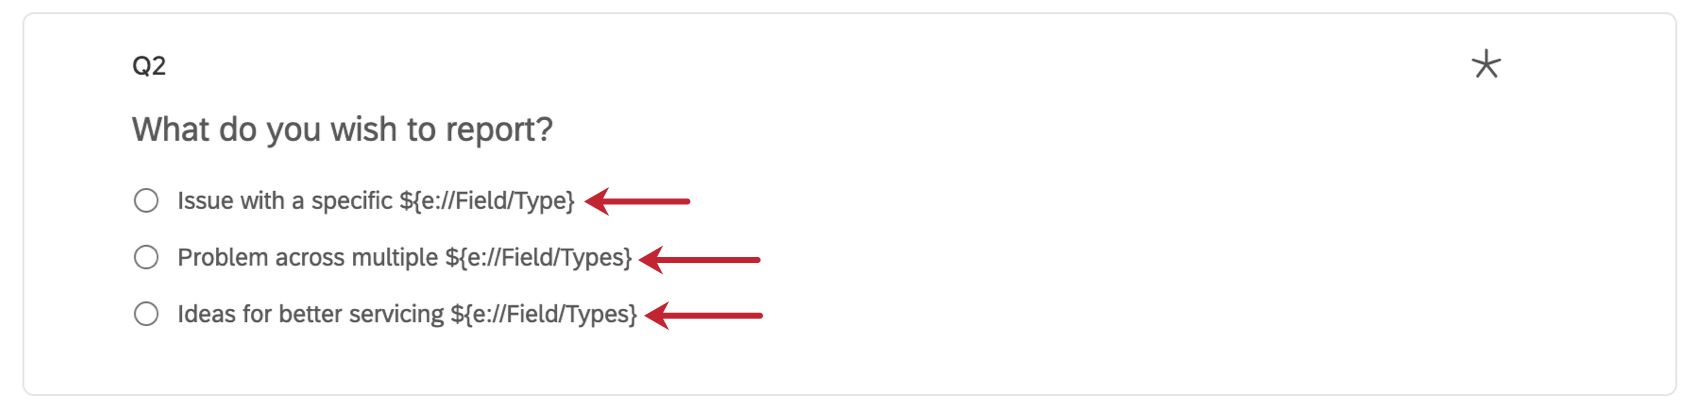
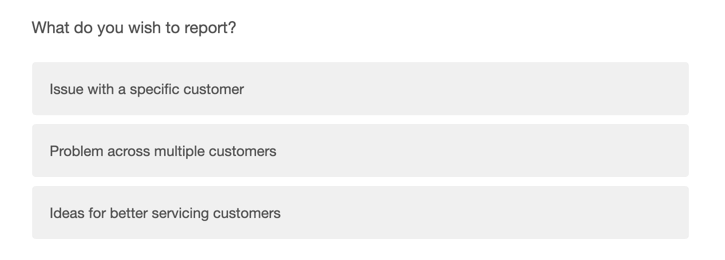
Don’t worry – when your respondents are completing the survey, they won’t see the piped text. Here’s how this same question looks when accessing the survey link or previewing:
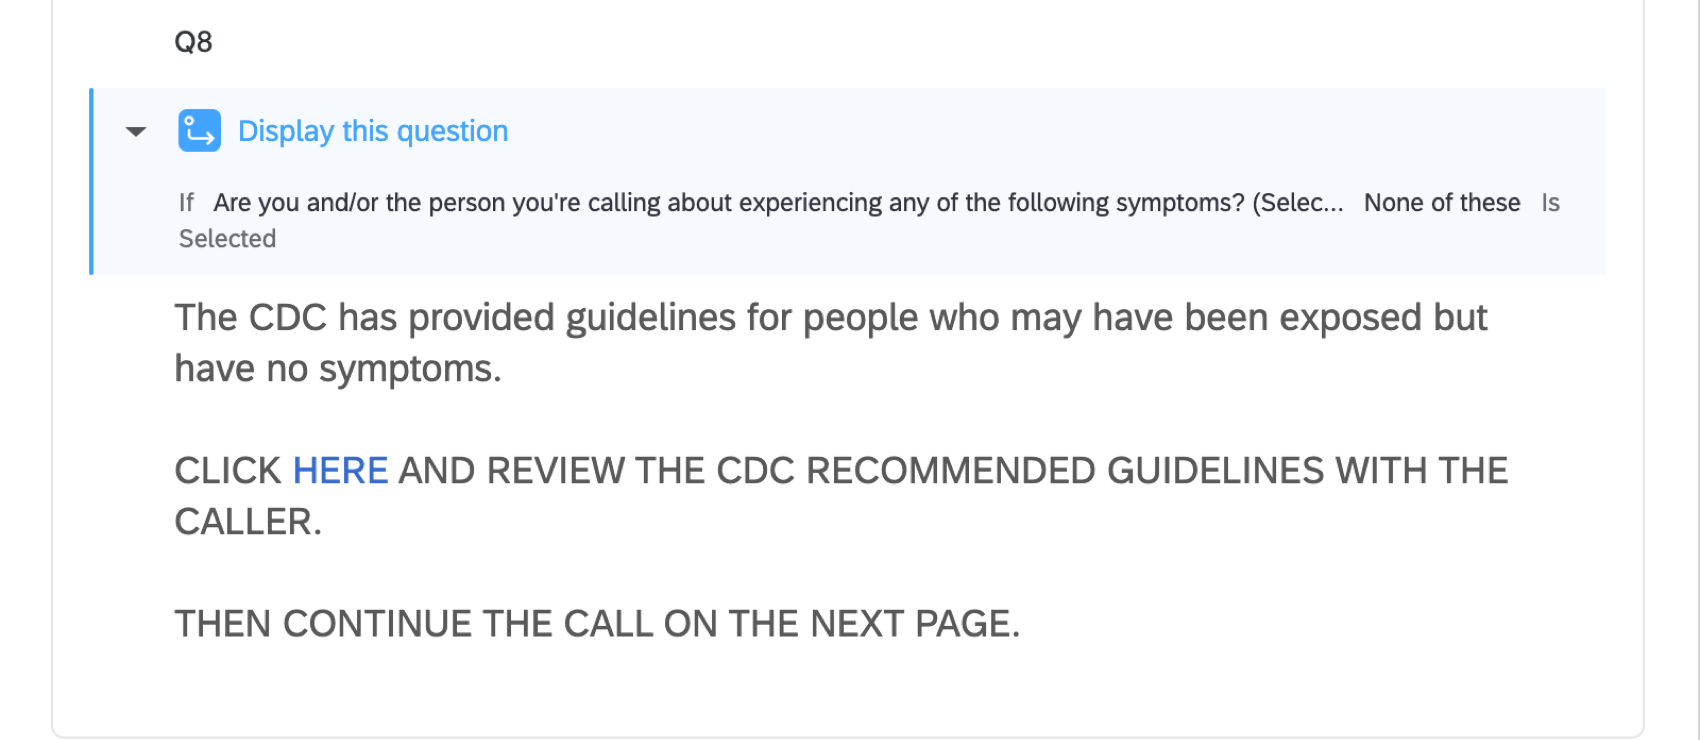
Display logic
A solution may come with custom display logic. Display logic affects what questions respondents see, based on previous answers they provided.
Example: The COVID-19 Dynamic Call Center Script gives call center employees different CDC advice to read based on whether the caller is already displaying symptoms of COVID-19.
Survey Flow
In the survey flow, you may find an embedded data element at the top. This element helps organize your data for reporting and pull data from the contact list into survey responses. You’ll notice this element has operational fields like Company Name, Industry, Division, Business Unit, and more listed.
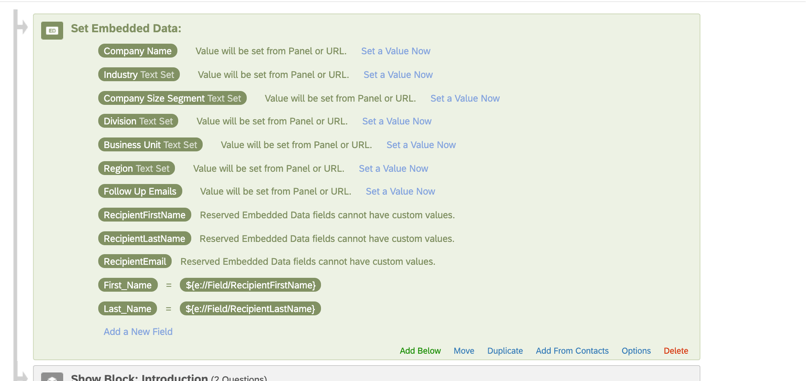
You may also see branch logic in your survey flow. Branch logic is often used to give customized paths and questions to respondents based on how they answered other questions, but it can also be used to format the data collected in the survey.
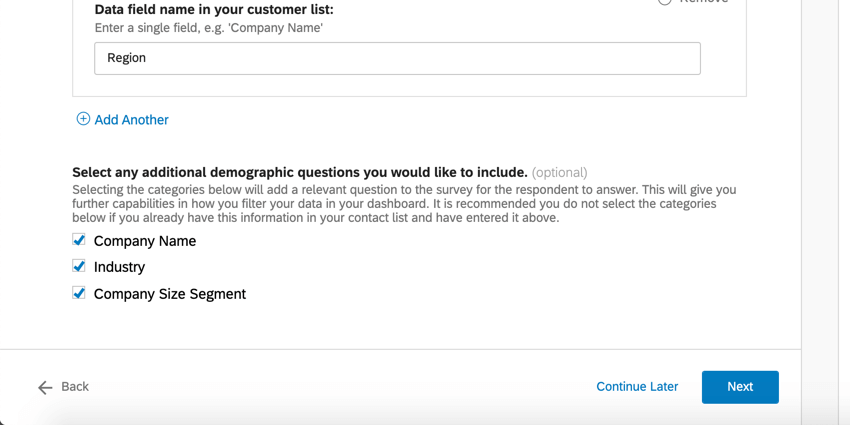
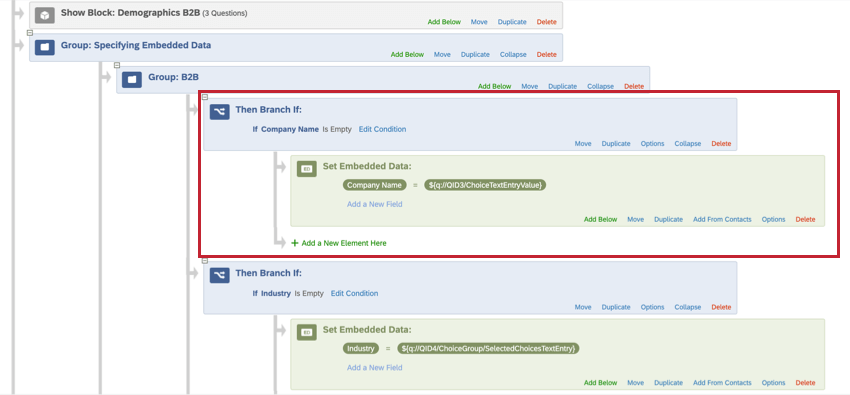
Example: During our Customer Confidence Pulse setup, we specified that we want to include questions about “Company Name,” because we didn’t include it in the contact list.
In the survey flow, a branch is used to check whether or not the question about company name was left blank. If it wasn’t, we’re going to create a field called “Company Name” and add a value to it. The piped text (surrounded by {brackets}) is pulling a survey question’s response and assigning this to the Company Name field.
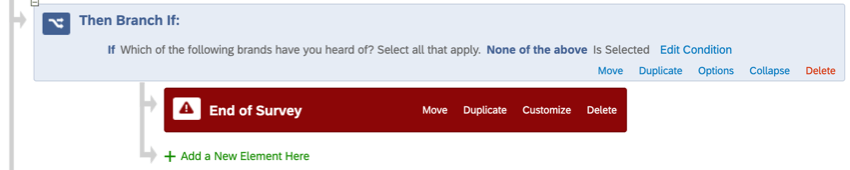
Example: One of the branches in the survey flow shown below leads to an end of survey element. That means whatever respondents meet the branch’s condition will be sent out of the survey early instead of being allowed to finish the survey. Any screen-out responses that are recorded will still count against your account’s response limit. To change this, carefully read the customization options available to you.
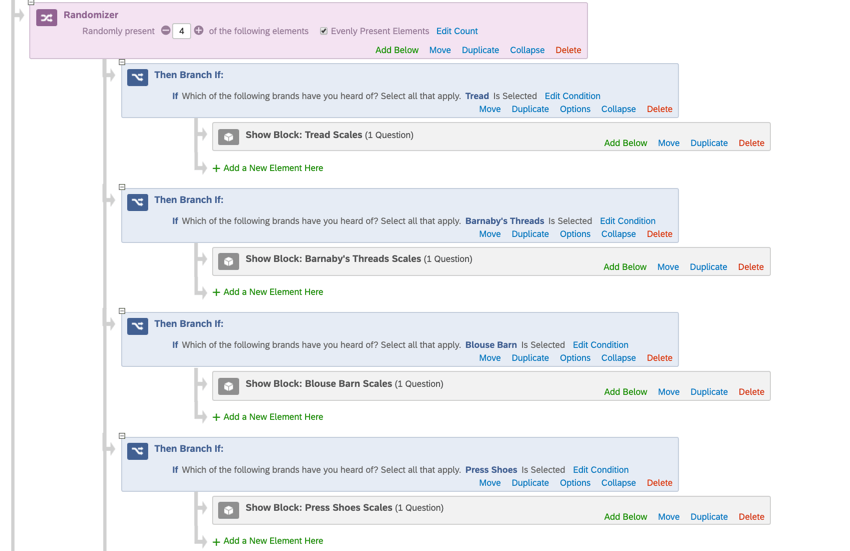
Another common element is a randomizer. This element randomizes the order that respondents see blocks of questions about brands they’ve indicated they know. Be very careful when making edits with a randomizer. For example, the one shown below is set up so that questions about the same brand are grouped together into blocks, but the order of those blocks is random. The randomizer will also do its best to make sure elements are evenly presented.
Survey Options
Survey options is where you go to change many general survey settings, such as the survey expiration date or the message that will appear to respondents when they finish the survey. Be sure to review these settings before distributing your survey.
Saving and Publishing
All edits you make are saved automatically; however, they won’t necessarily be pushed to the live version of the survey. When you are finished with all of your edits and are ready to generate a link and share the survey with your customers, remember to click Publish in the upper-right.
For more on how this works, see Survey Publishing & Versions.
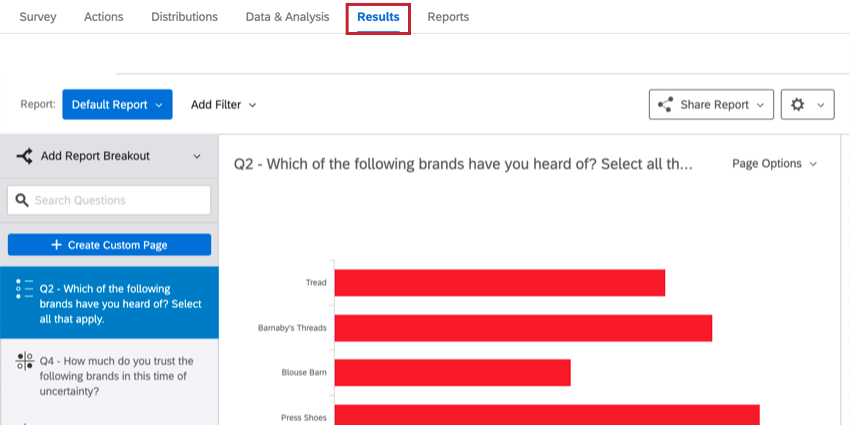
Reports
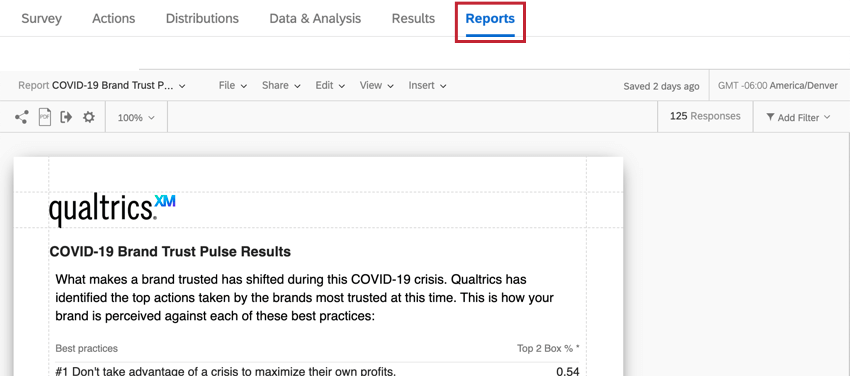
Premade Reports
Moat guided solutions come with a report developed by our XM Scientists. This report gives an overview of the results and is ready to share as soon as you have collected data.
- Sharing the Report: You can share a PDF copy of this report with your colleagues, or even create a link where anyone can view the report! See Sharing Your Advanced-Report.
- Making New Reports: You can click File and then New to create a new report from scratch if needed. Use the report name dropdown to navigate between reports.
- Customizing Reports: See Advanced-Reports Basic Overview to get started customizing your reports.
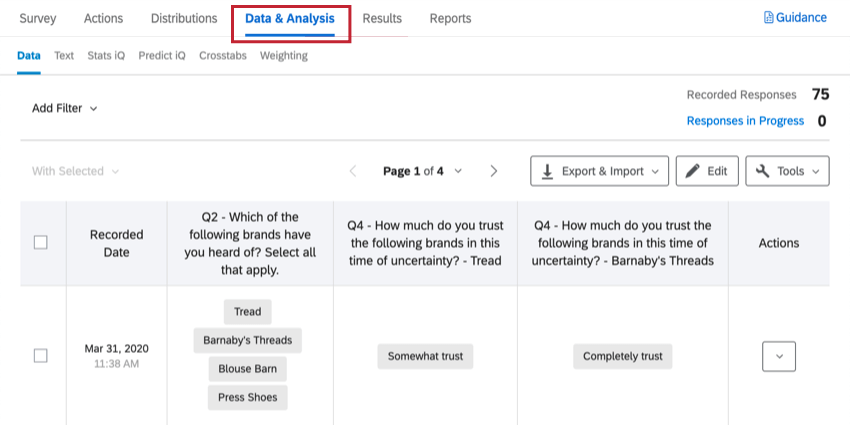
Other Ways to View Data
Data & Analysis allows you to edit data, export a spreadsheet of all responses, filter your responses, and much more.
Results-Reports give a quick overview of your data, and do not require you to work from scratch. They have different charts and graphs than Advanced-Reports, and are generally there to help you get quick assessments of data.